Firmware
The firmware runs on the Arduino Uno board. The board is connected via an Universal Serial Port (USB) to the host computer which runs the measurement software. It’s main job is to handle incoming commands (via serial port) and send back feedback notifications.
Available Commands
Detailed information about the input and output about the firmware is described in the LED Protocol.
References
Verification
To ensure the flickering frequency a verification measurement has been done with VOLTCRAFT Universal SYSTEM MS-9150 Frequency Counter.
An important Note: The delay() method on the Arduino passes the delay in integer values, no floats are possible. For every milliseconds below 16383, delayMicroseconds() must be used. The gap happens between 30Hz and 31Hz.
Methodology
Voltage has been captured at the pins directly at the measured LED. Each frequency was measured two times and the latter value was used.
Note: Prior sample measurements showed, the value didn’t changed after the second measurement for each frequency.
Results
| Frequency | Measured Frequency | Offset |
|---|---|---|
| 10Hz | 9,996 | -0,004 |
| 11Hz | 11,105 | +0,105 |
| 12Hz | 12,186 | +0,185 |
| 13Hz | 13,146 | +0,146 |
| 14Hz | 14,270 | +0,270 |
| 15Hz | 15,071 | +0,071 |
| 16Hz | 16,110 | +0,110 |
| 17Hz | 17,220 | +0,220 |
| 18Hz | 18,488 | +0,488 |
| 19Hz | 19,200 | +0,200 |
| 20Hz | 19,966 | -0,034 |
| 21Hz | 21,567 | +0,567 |
| 22Hz | 22,678 | +0,678 |
| 23Hz | 23,756 | +0,756 |
| 24Hz | 24,935 | +0,935 |
| 25Hz | 24,941 | -0,059 |
| 26Hz | 26,245 | +0,245 |
| 27Hz | 27,704 | +0,704 |
| 28Hz | 29,191 | +1,191 |
| 29Hz | 29,196 | +0,196 |
| 30Hz | 31,138 | +1,138 |
| 31Hz | 30,772 | -0,328 |
| 32Hz | 31,723 | -0,277 |
| 33Hz | 32,712 | -0,288 |
| 34Hz | 33,702 | -0,298 |
| 35Hz | 34,689 | -0,311 |
| 36Hz | 35,673 | -0,327 |
| 37Hz | 36,657 | -0,343 |
| 38Hz | 37,646 | -0,354 |
| 39Hz | 38,633 | -0,367 |
| 40Hz | 39,621 | -0,379 |
| 41Hz | 40,598 | -0,402 |
| 42Hz | 41,590 | -0,41 |
| 43Hz | 42,578 | -0,422 |
| 44Hz | 43,562 | -0,438 |
| 45Hz | 44,544 | -0,456 |
| 46Hz | 45,275 | -0,725 |
| 47Hz | 46,520 | -0,48 |
| 48Hz | 47,500 | -0,5 |
| 49Hz | 48,481 | -0,519 |
| 50Hz | 49,465 | -0,536 |
| 51Hz | 50,454 | -0,546 |
| 52Hz | 51,436 | -0,564 |
| 53Hz | 52,414 | -0,586 |
| 54Hz | 53,152 | -0,848 |
| 55Hz | 54,389 | -0,611 |
| ... | ||
| 500Hz | 468,991 | -32,009 |
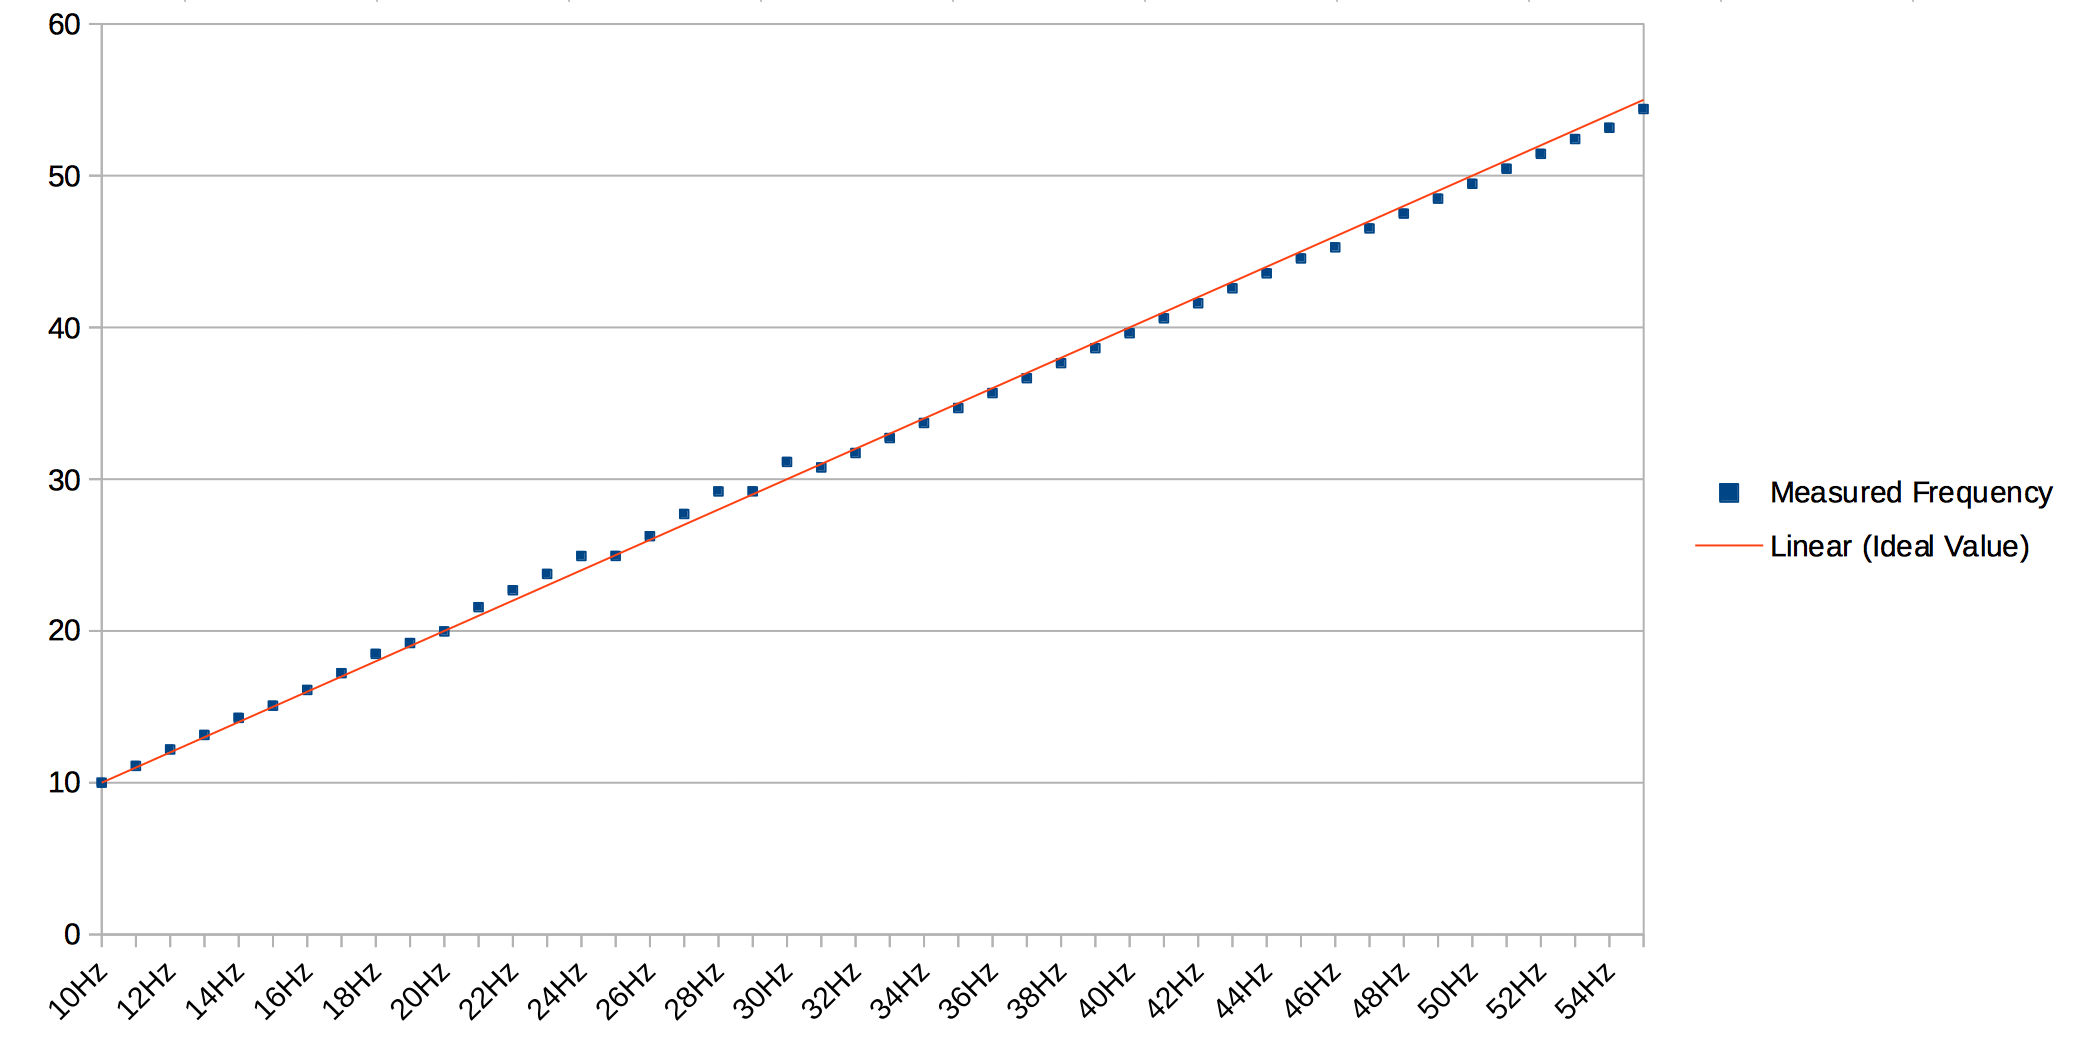
The next graph shows the scattering of the measured values around the expected linear ideal values.